Score Formula
In this article we will explain how the project score, item type score are calculated.
The current version is in use since 2024-07-12.
General Goals & Ideas
There are 3 goals the OyenCov seeks to achieve with the score formula:
- Preserving the legacy test coverage goal: Ensuring every method in use, is being tested at least once.
- Incorporate usage weights into scoring, to help the engineers in prioritizing efforts into frequently used, thus commercially important parts of the codebase.
- Ensure the testing effort of the codes correlate with their respective usage weights in production.
In the current formula, Methods are the first class citizens we measure usages & weightings of, including controller actions and background jobs’ perform method. We currently don't look at conditional branches and Ruby lambdas/procs/blocks, we will revisit them when we have the bandwidth and needs to.
There will be a time OyenCov supports other languages and ecosystems, this guide shall be more language agnostic. Henceforth we will call these Methods as Items.
Quick examples:
- A project that do not have any tests, it should score 0%.
- Simplecov score will not be a 0% here because of classes, modules, methods being autoloaded. Autoloading alone green checks the declaration lines.
- For a project with 100% legacy test coverage, but where the efforts are completely misplaced, it should score 50%.
- For a project with 100% legacy test coverage and where test case overlaps follow real world usage, it should score 100%.
- A more extreme example: For a project with test coverage only on their 20% most used codebase, we can expect an OyenCov score up to 80% due to the Pareto scoring used in usage-weighting.
- Conversely, a project that has 80% legacy test coverage but misses all the top 20% most used codebase, will score at most 20% in OyenCov.
Usage Weighting with Pareto Scoring
In real life, the most used items in any given codebase running in production will have orders of magnitude higher raw execution counts (hereafter known as hits) than next other items that follow. So we cannot just multiply raw usage count by the test-prod deviation, it will not produce a meaningful score for us to improve things.
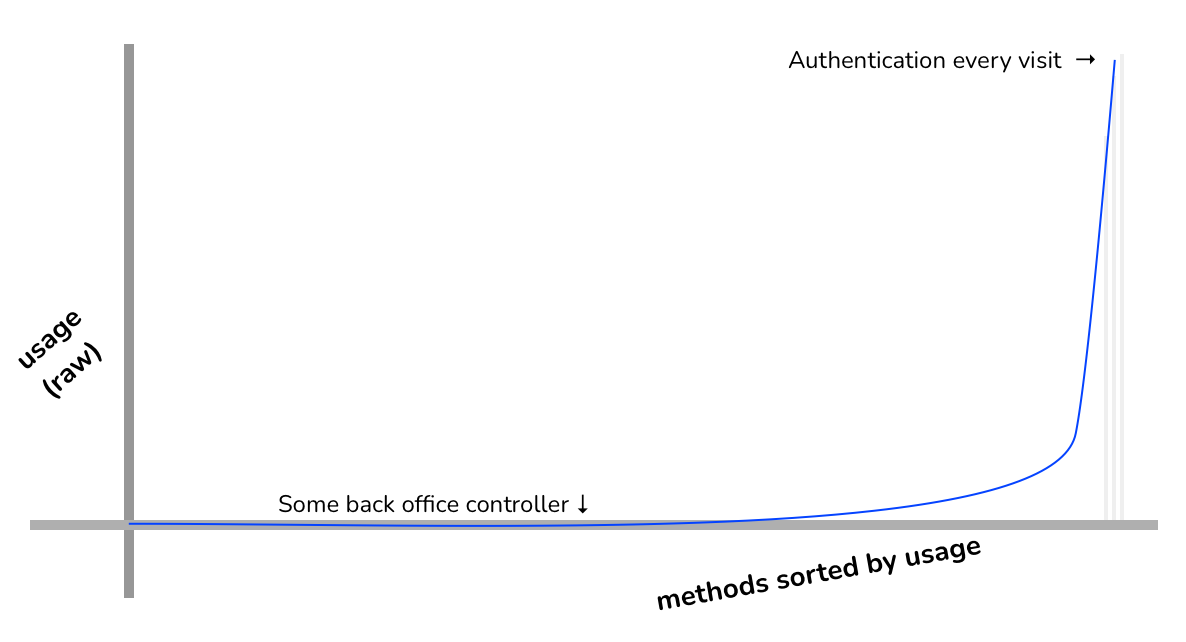
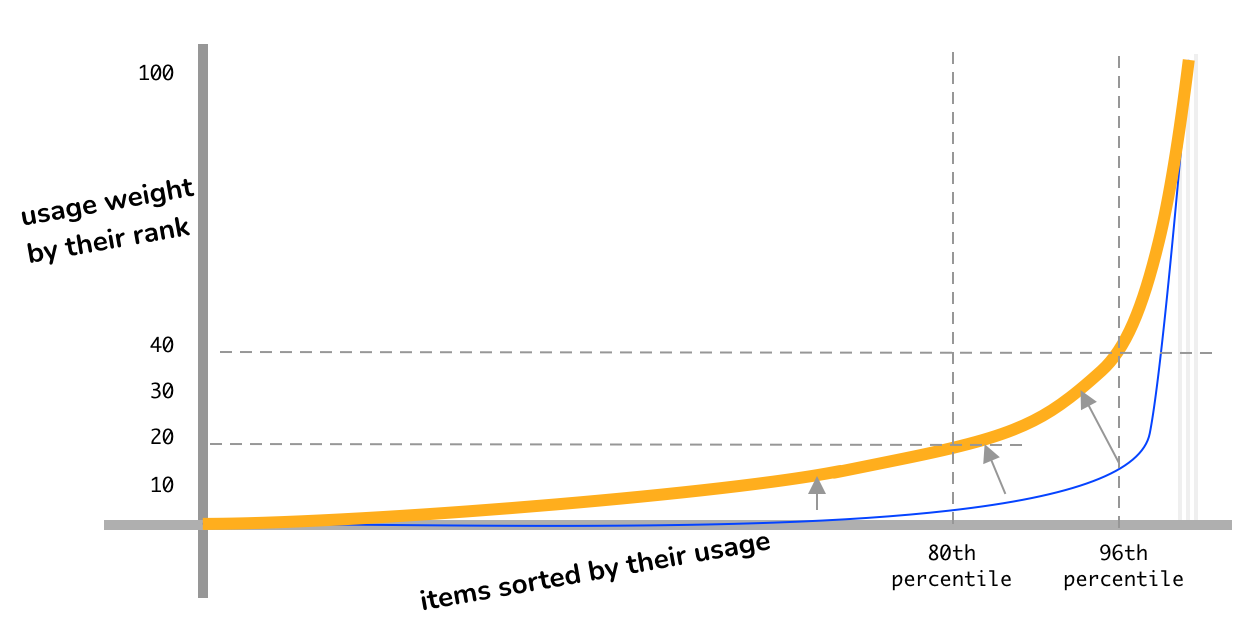
Instead we first rank the items according to their raw usage count, and then apply Pareto scoring to determine their usage weight.
Formula:
Examples:
- Item having 0th percentile of production runtime execution count will get a usage-weight of 0.
- 80th percentile → 20
- 96th percentile → 40
- 100th percentile → Ideally ~100, but this differs based on the number of items being ranked and scored.
All items that are not detected being used in production will be ignored when calculating final score.
Test-Prod ranking deviation for each item
To be expanded and add visualizations.
For items that are used in production but not tested, we automatically assign a deviation of -100%.
Now for the items that are both used and tested, they are sorted according to how many times they have been run in production and CI.
Then we take the percentile of their orders, calculate the difference in percentiles. If the test run percentile is less than the production run percentile, the item is said to have a negative test-prod deviation, that will be used to calculate item severity score.
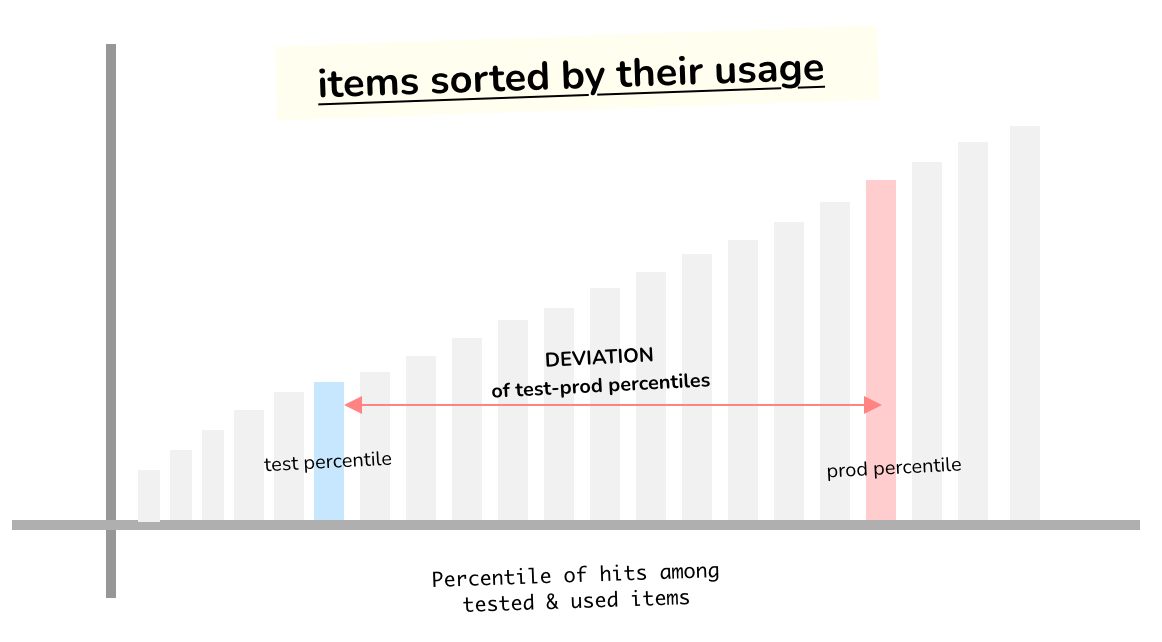
Only items that are not tested or have a negative deviation will be penalized.
Final Scorings
To be expanded.
- Item Severity scoring = Usage-weight ✖ Deviation
- General Category & Project Scoring = ∑(Usage-weight ✖ Severity)/∑(Usage-weight)
The scores have a range of 0-1000. Using percentage doesn't make much sense in our context, and we want to emphasize this score is not to be treated the same way as legacy test coverage percentages.